delay-discounting-analysis
Hypothesis testing [A WORK IN PROGRESS]
As outlined in the paper, you could take 2 routes (at least) to your research conclusions, see Figure below. See the paper for details and a worked example.
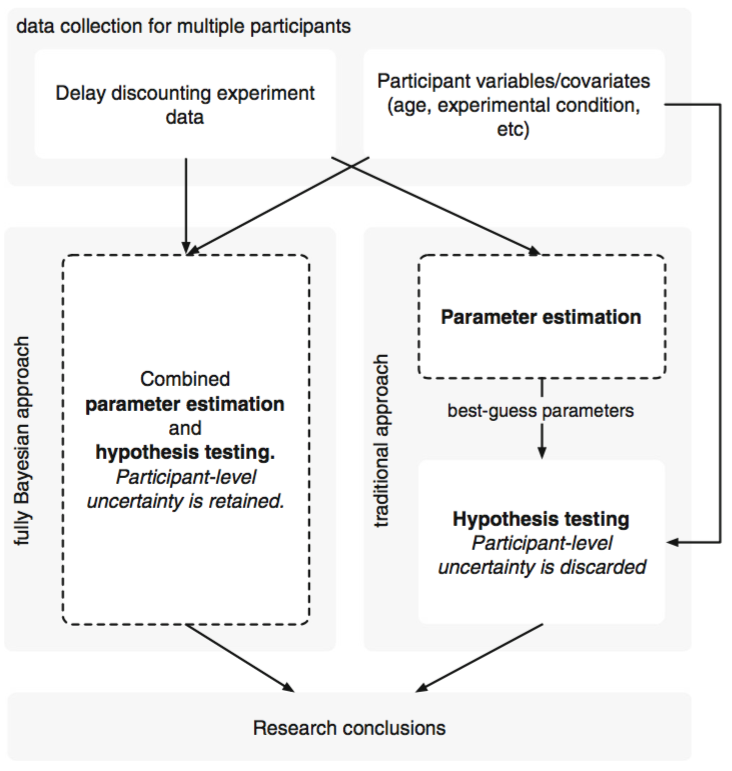
Approach 1: ‘Traditional’ inference with point estimates
The first route would involve using this software to calculate posterior distributions over discounting parameters. We can then export point estimates (e.g. mean, median, mode) of the distributions. This data can then be imported into any statistical analysis package, potentially combined with other participant data available, and various tests could be done. These could be standard frequentist hypothesis tests, or you could use a Bayesian approach. These can be done in your analysis package of choice, such as R, SPSS, or JASP.
Point estimate type
You can specify your preferred point estimate type (either mean, median, or mode), and this will be used for all plots, analyses, data export. Obviously, you will need to have a rationale for choosing one form of point estimate over another and justify this to the reviewers of any paper that you write. See the example code for examples of how to specify the point estimate type.
Approach 2: Fully Bayesian approach
Even if you run Bayesian analyses in the ‘traditional’ approach, then you have still lost information. This toolbox provides you with posterior distributions over discounting parameters, but the compressive step of exporting point estimates for easy import to a stats package means that this distributional information is lost.
You can take a more thoroughly Bayesian approach by running various hypothesis tests (or examining credible regions) based upon the full posterior distributions. The paper provides a simple example to test whether the there is a group level magnitude effect.